
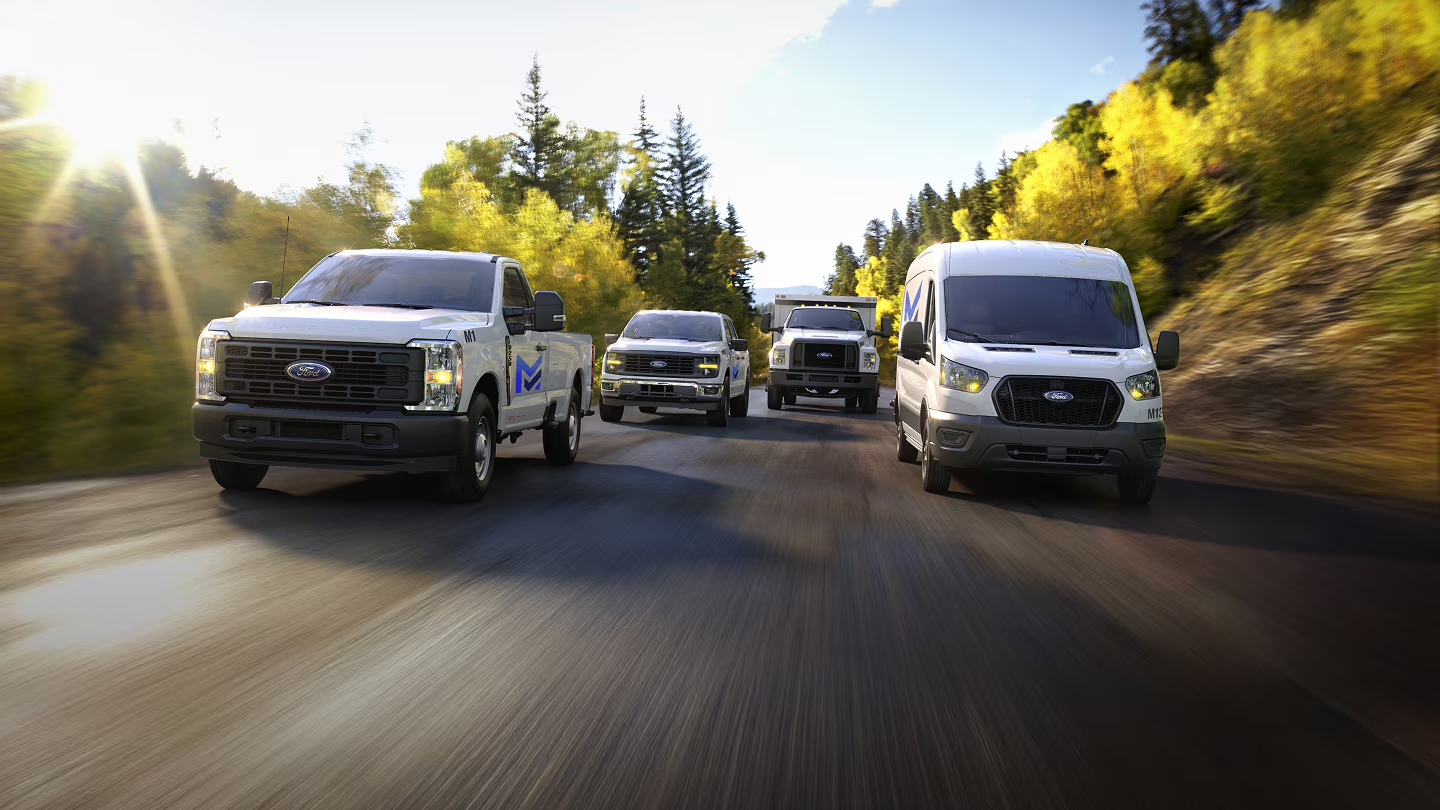
Ford Pro Telematics is a fleet management platform used by businesses in over 10 countries—including law enforcement agencies, enterprise fleets, and car rental services.
The platform helps fleet operators improve efficiency, safety, and vehicle uptime through features like:

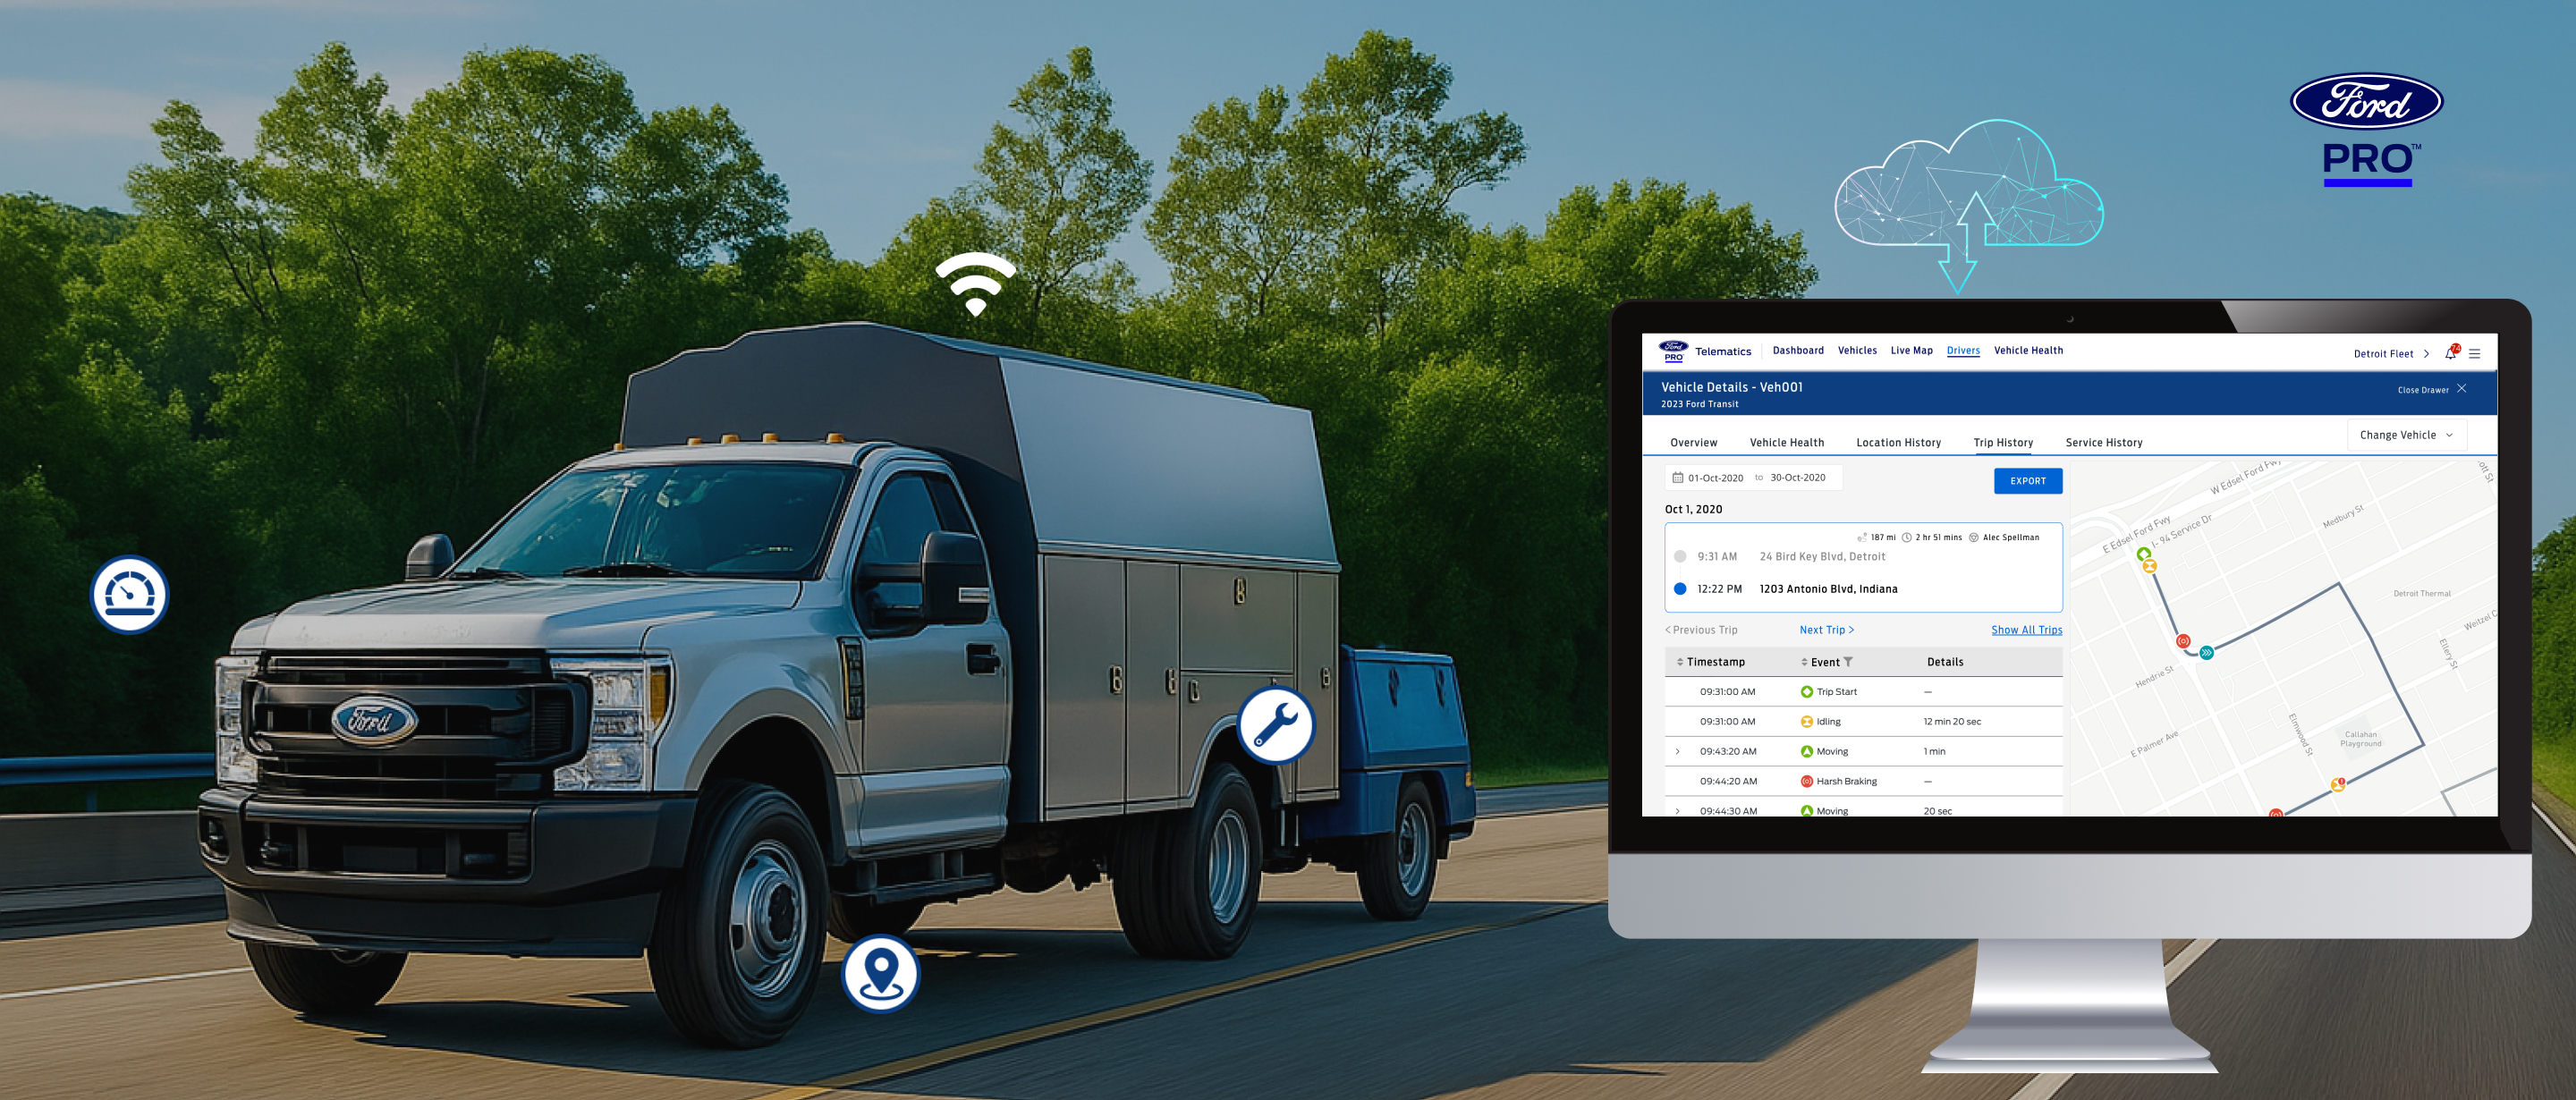
Telematics is the technology that enables vehicles to send and receive data.
A Telematics Control Unit (TCU) in the vehicle collects data such as speed, location, and engine status. This data is sent wirelessly via cellular or satellite networks to a cloud server for storage and analysis. The processed data is then turned into real-time insights, which are displayed in a dashboard or app for easy monitoring and decision-making.

One unsafe habit. One missed trend. One accident.
Driver behavior can make or break a fleet’s safety record — but when “behavior” could mean anything from phone use to harsh cornering,
how do you know what truly matters?
We aimed to cut through the noise and deliver a system that’s not just a scorecard, but a tool for prevention, coaching, and change.


I led the initial discovery phase using both qualitative and quantitative methods, despite limited direct access to users.
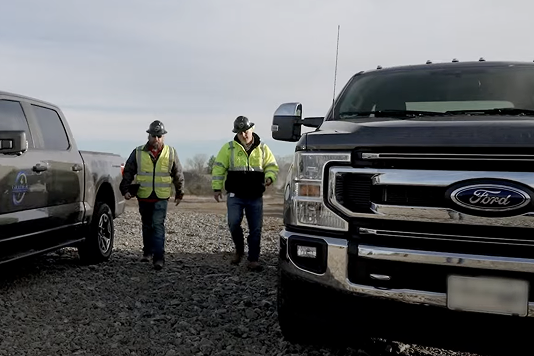
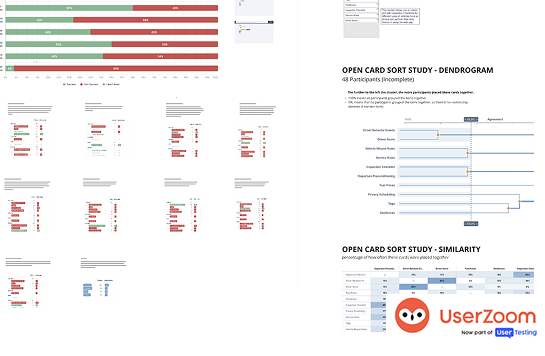
I began by reviewing 30+ past interviews to identify knowledge gaps, then conducted 3 onsite visits to observe fleet operations and speak with users in context. To validate and scale our insights, I launched a UserZoom survey with over 50 fleet managers. I also analyzed leading competitors—Samsara, Verizon Connect, and Geotab—to uncover best practices and opportunity areas.


I collaborated with two other designers to synthesize user pain points and conduct quantitative analysis. Together, we created a user matrix to help us prioritize problems based on impact and frequency.
To comply with my non-disclosure agreement, I have omitted and obfuscated confidential information in this case study. All information in this case study is my own and does not necessarily reflect the Ford Pro Telematics.

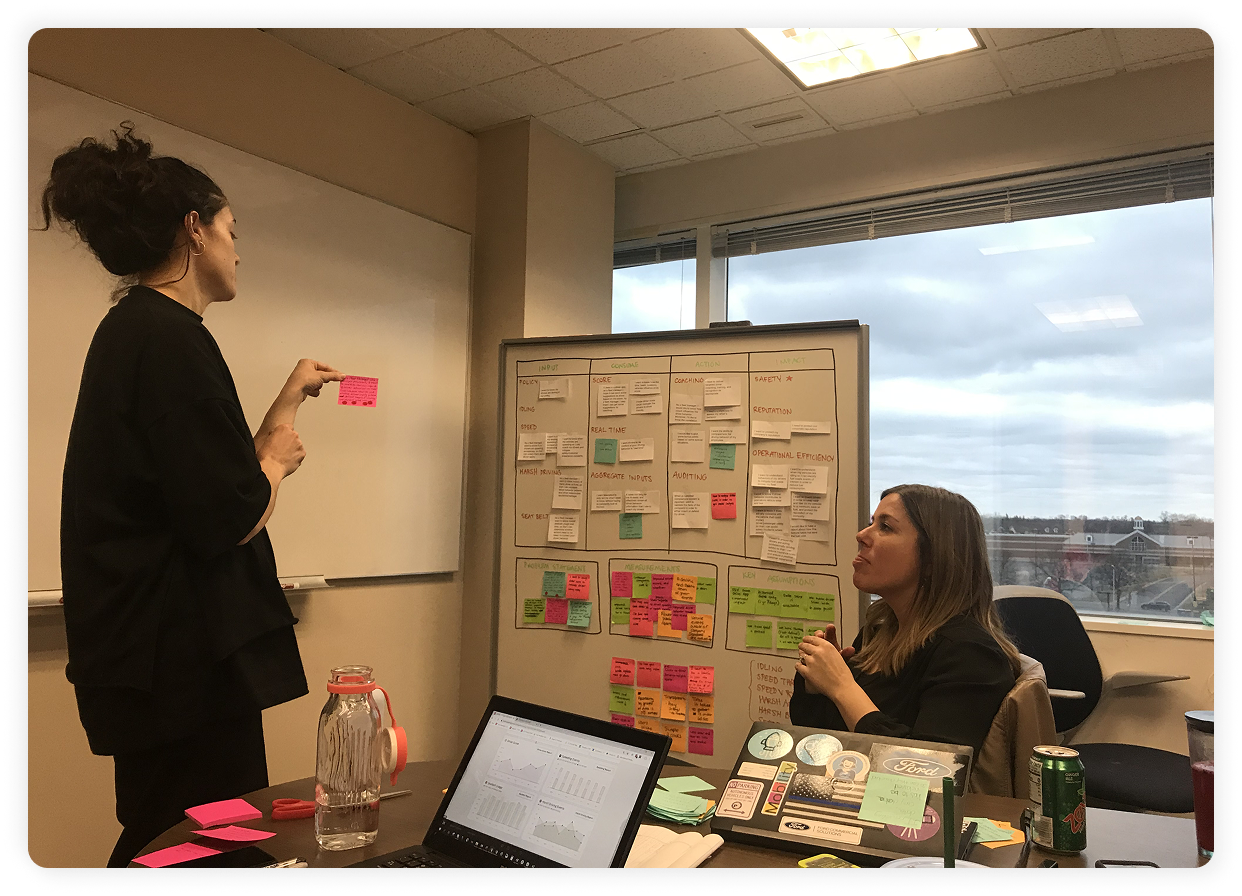
I then facilitated a workshop with product owners, designers, and product managers, where we synthesized our findings on driver behavior into three key insights to guide the product strategy.
As a Fleet Manager who managing personnel,
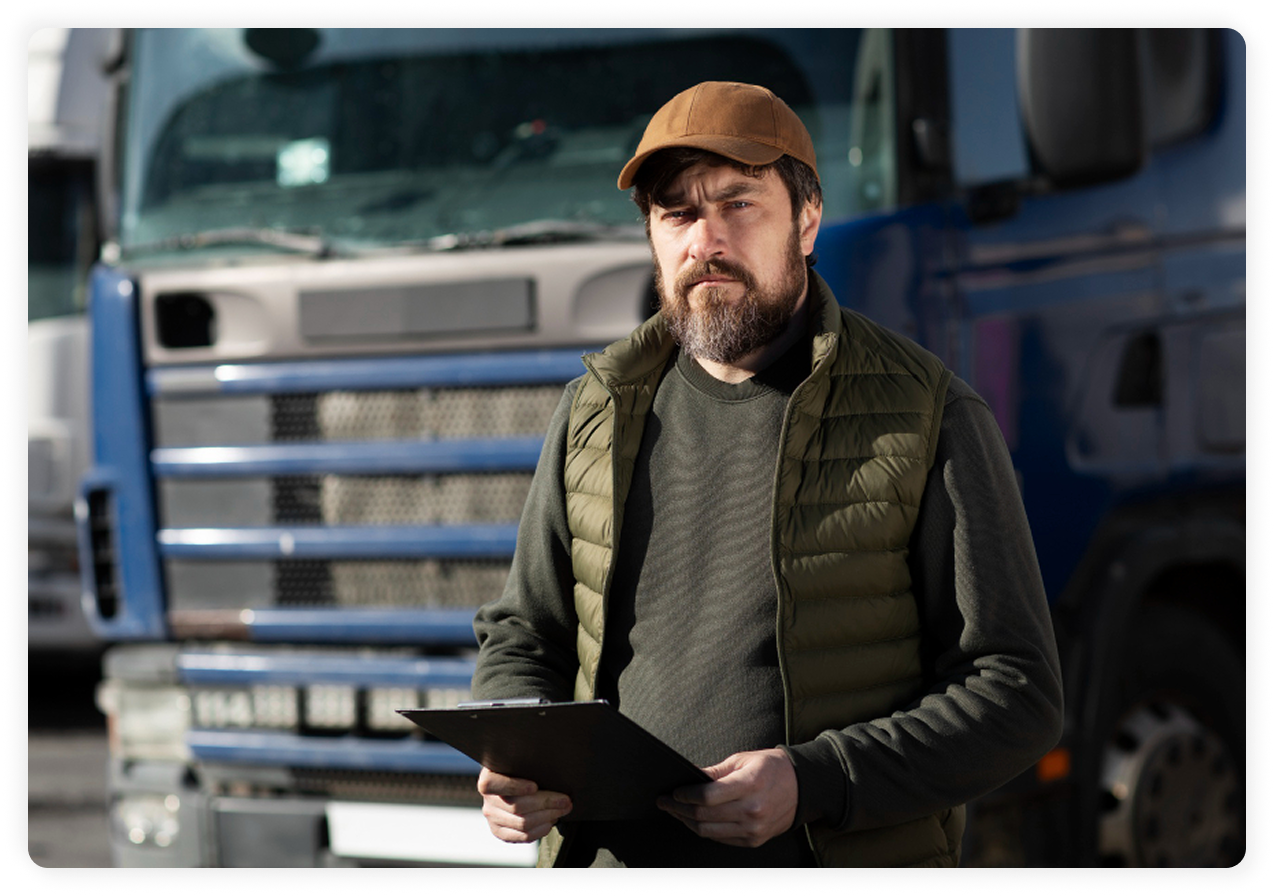


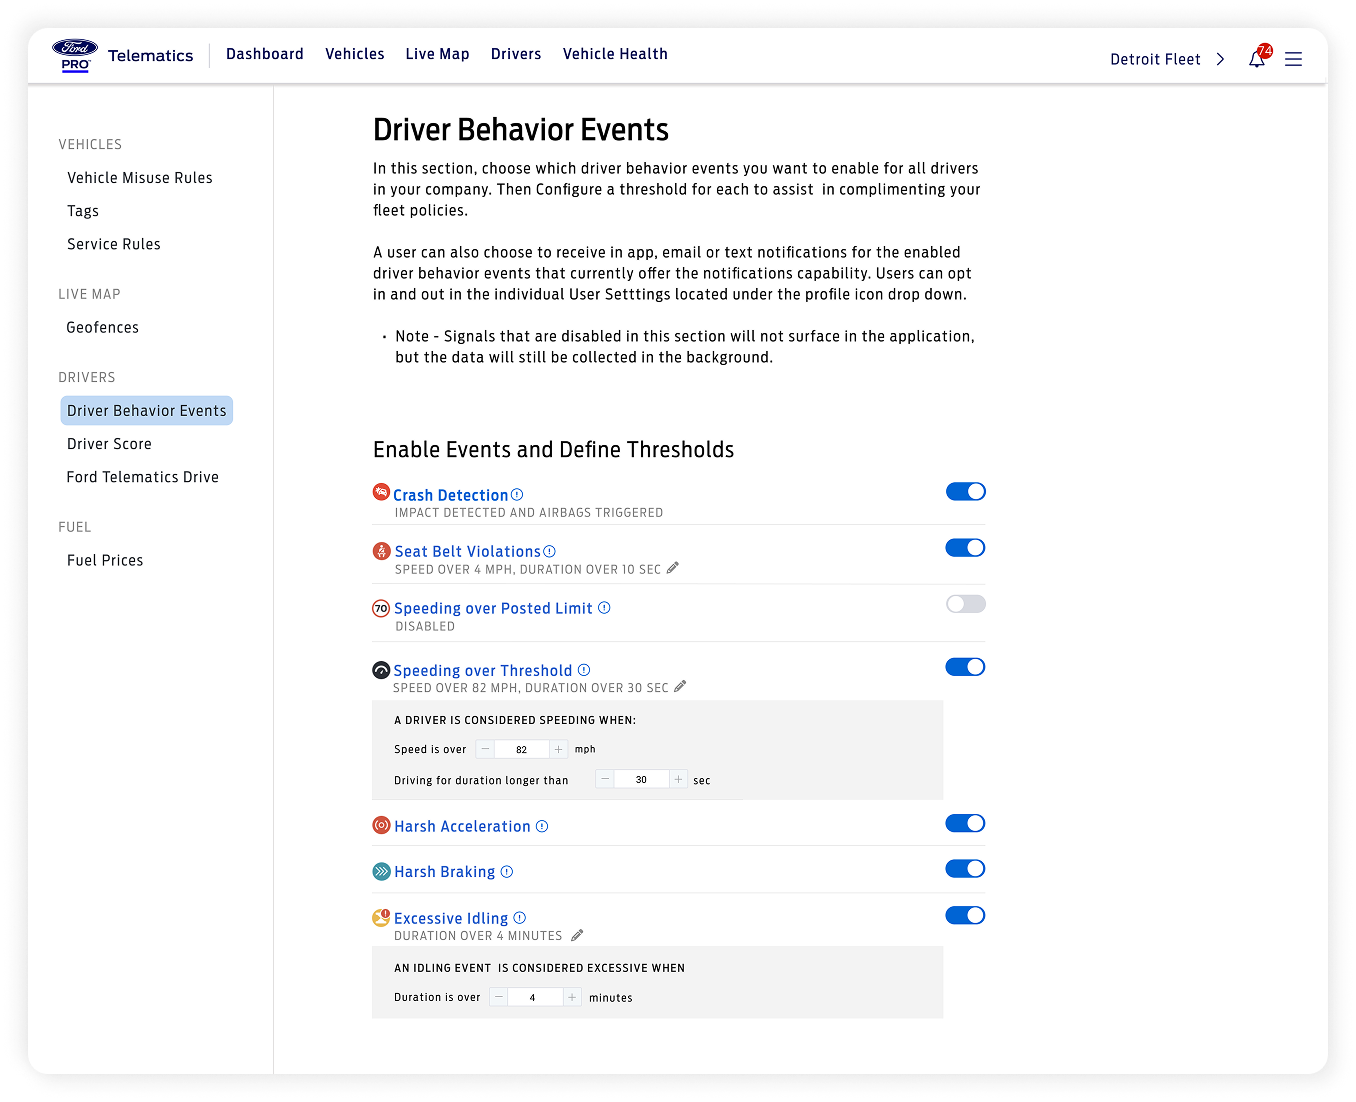
Fleet managers need to define thresholds that match their operational context.


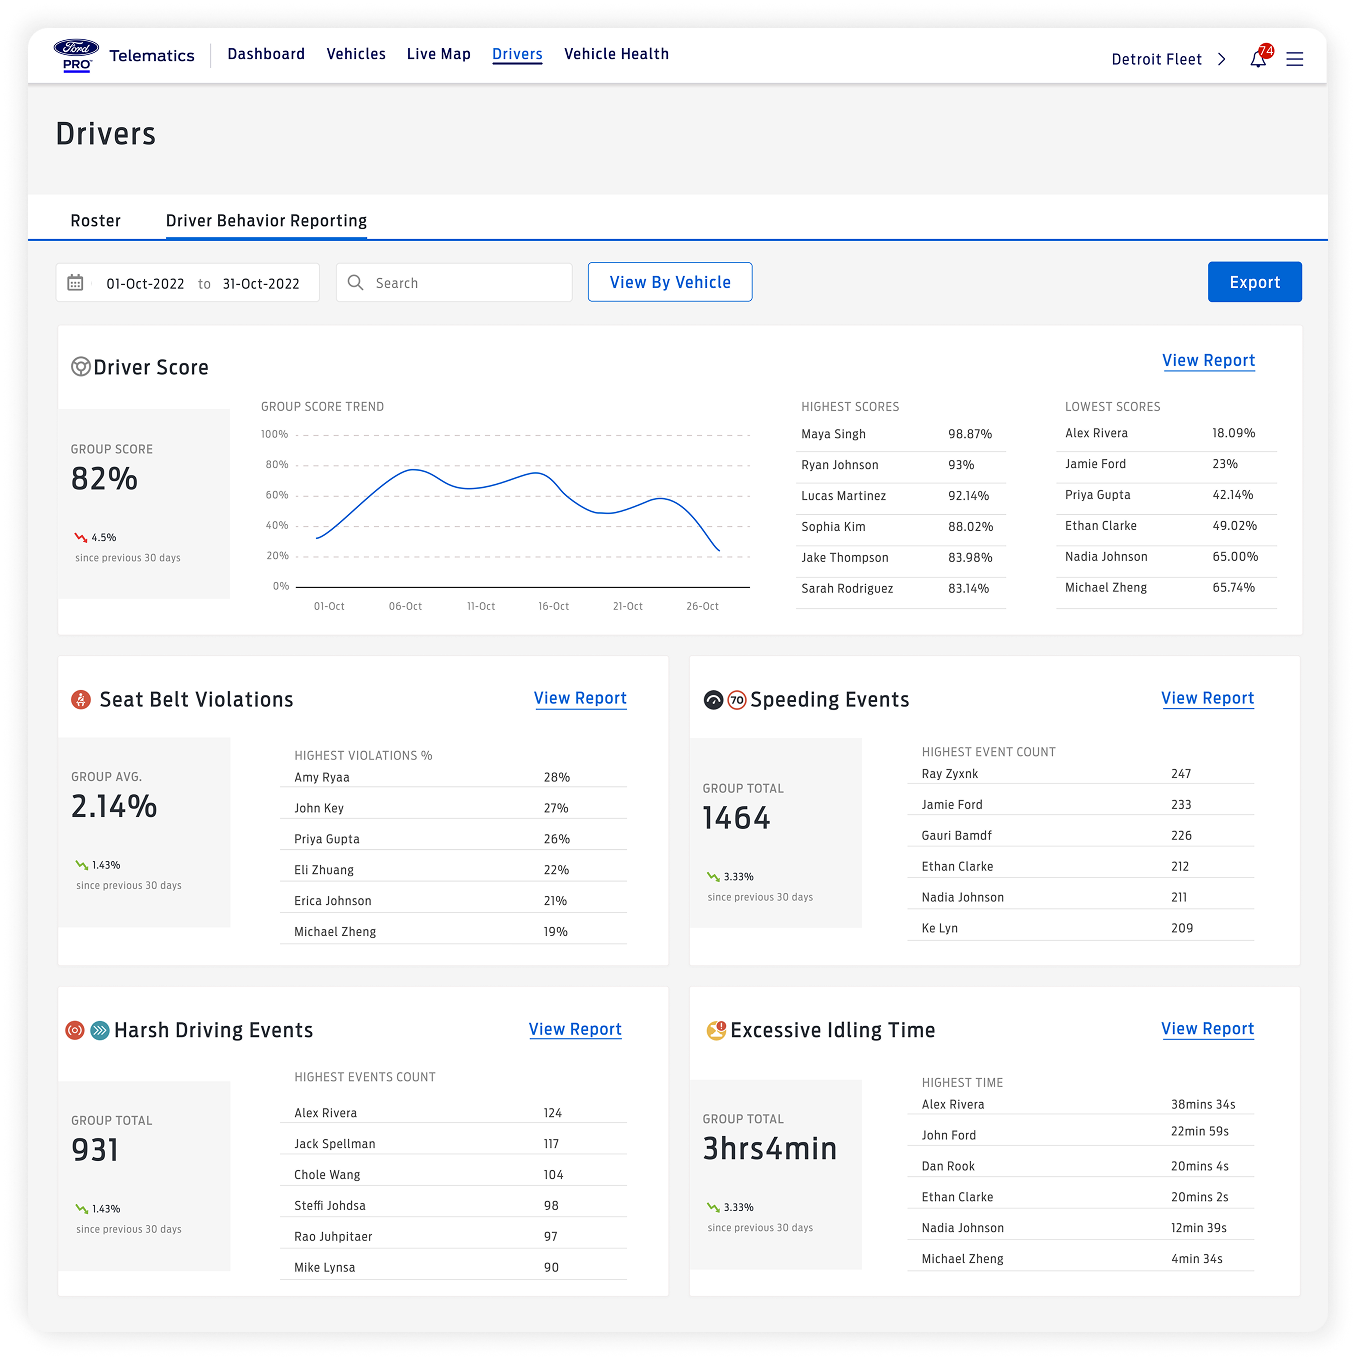
Monitoring driver behavior over time is more valuable than looking at isolated events.

Managers need to trace issues back to specific trips, locations, and times to provide actionable feedback.

Based on what we learned from research, I worked with product and business stakeholders to define a focused product strategy. Our goal was to balance quick rollout with long-term vision — delivering early value to fleet managers while laying the foundation for revenue-generating services aligned with Ford Pro’s 2023 targets.
Empower fleet managers to proactively manage driver safety through clear, contextual, and trustworthy behavior insights — while supporting Ford Pro’s global vision for connected services growth.

Build a driver behavior experience that delivers immediate value, builds user trust, and scales across fleet sizes, roles, and markets — with a clear path from free trial to paid adoption.

Alongside our strategic priorities, I defined a set of design principles to guide decision-making across product, design, and engineering:
I partnered with cross-functional teams—including engineering, product, and the Vehicle Control group—to translate strategic insights into a focused MVP. We aligned on priorities, business goals, and scoped each feature based on feasibility and impact.

I partnered with cross-functional teams—including engineering, product, and the Vehicle Control group—to translate strategic insights into a focused MVP. We aligned on priorities, business goals, and scoped each feature based on feasibility and impact.
I facilitated a workshop with stakeholders where we mapped key driver behaviors in a 2x2 matrix.
We defined impact based on what users care about most—safety was the top priority, then cost savings. So, we marked safety-related behaviors as high impact and the rest as lower impact.
We then collaborated with engineers to assess the development effort required for each item.

However, the Engineer Team said all harsh events and distracted driving on the purple cards were too complex to include in the MVP.

I understand that Harsh cornering relies on advanced sensor data, and distracted driving detection depends on dash cam footage and real-time analysis.
What about Harsh Acceleration and Braking?
At first, these may seem easy to calculate—like tracking how quickly a vehicle goes from 0 to 80 mph. So, why not just let users set their own thresholds? It’s not that simple.
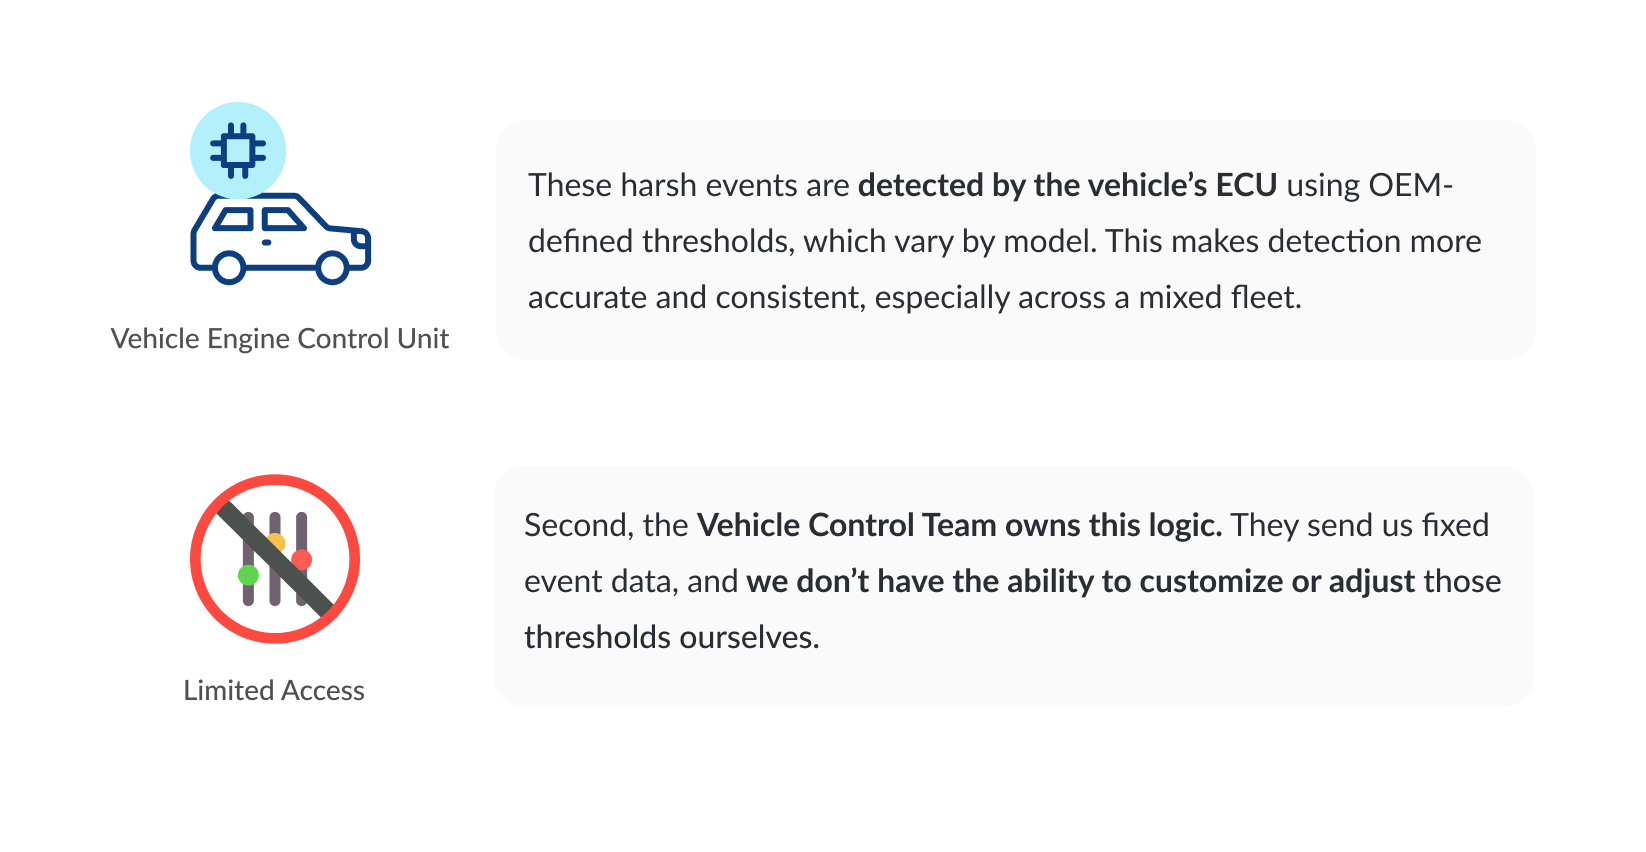
I decided to moved forward with Harsh Acceleration and Harsh Braking events, even though users can’t configure the thresholds yet.
Tracking these events still provides immediate value with accurate, high-confidence data.
We also kept the roadmap open for future customization and began working with the Vehicle Control team to explore deeper configurability..

We scoped the MVP to focus on delivering key insights with minimal engineering lift. Given the small team size and limited frontend resources, the Engineering Lead proposed using a third-party data visualization tool for all reporting pages.
Since Ford had already invested in Salesforce services, we chose Tableau to reduce both time and cost. This decision allowed us to ship faster while balancing technical constraints, budget considerations, and long-term scalability.
To help managers understand risky events, we knew we needed to show when and where they occurred.
Initially, we planned to create a new Driver Details drawer to show overall performance and trip history.
But then we realized:
- The Vehicle Details drawer already contains much of this context
- Vehicle data is an essential part of the story
- Reusing the existing component would save significant engineering effort
So we chose to add a new tab to the Vehicle drawer — a solution that’s both user-centered and implementation-friendly.

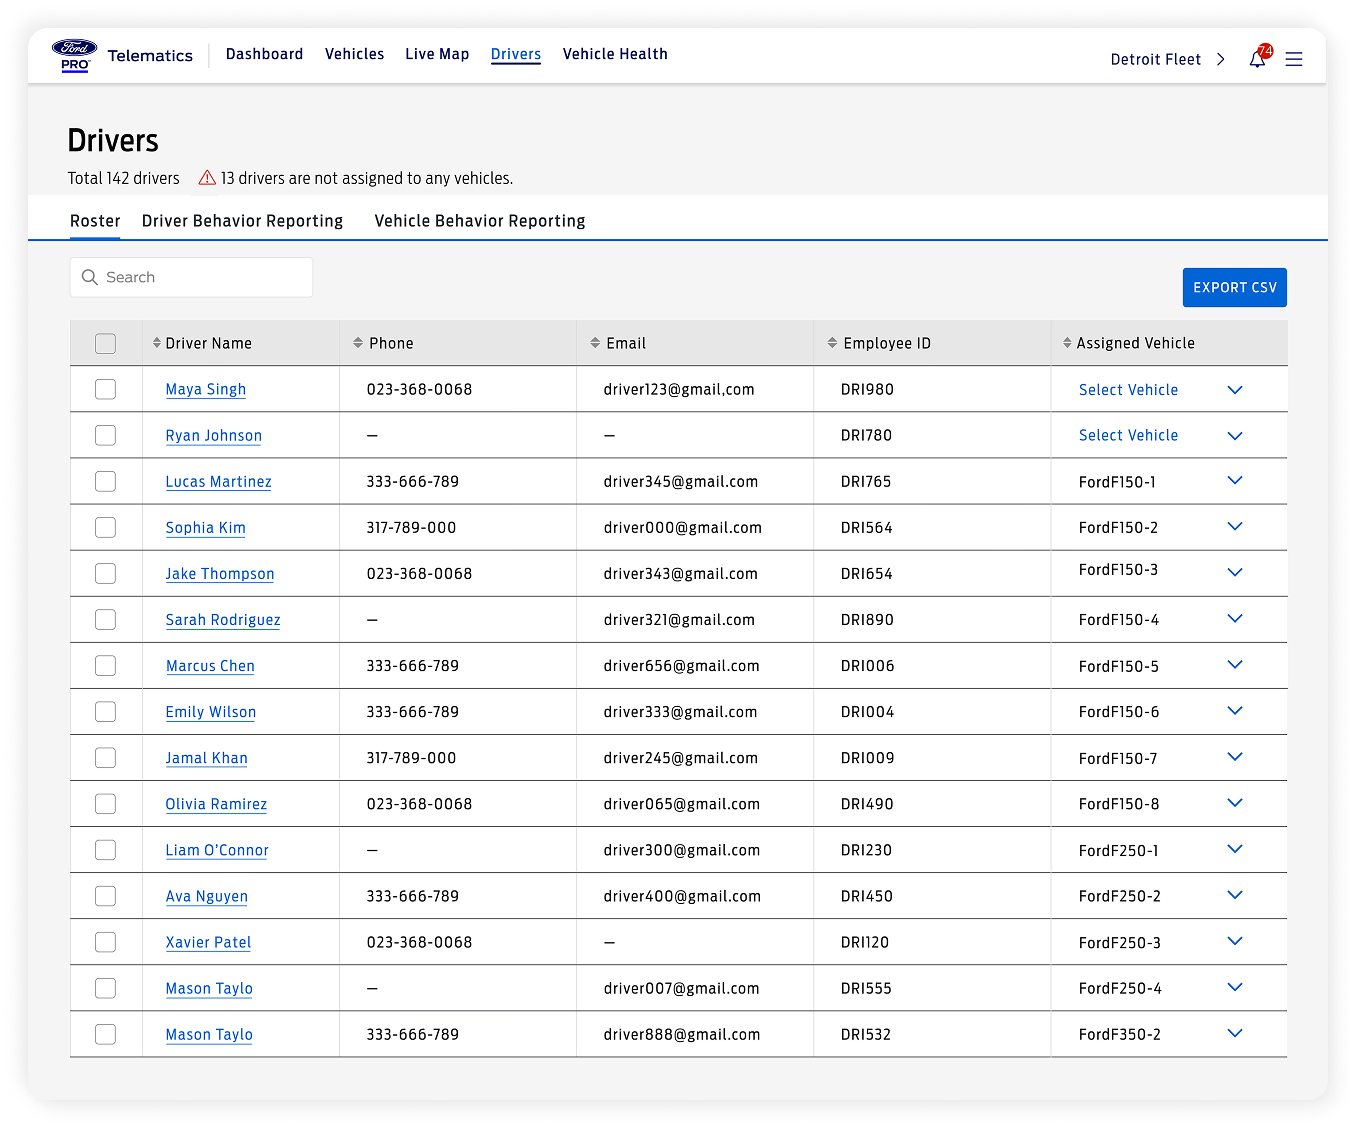
However, from a UX designer’s perspective, I noticed we had overlooked a crucial step: identifying the driver behind the wheel at any given time. I took the initiative to explore this gap and proposed potential solutions.

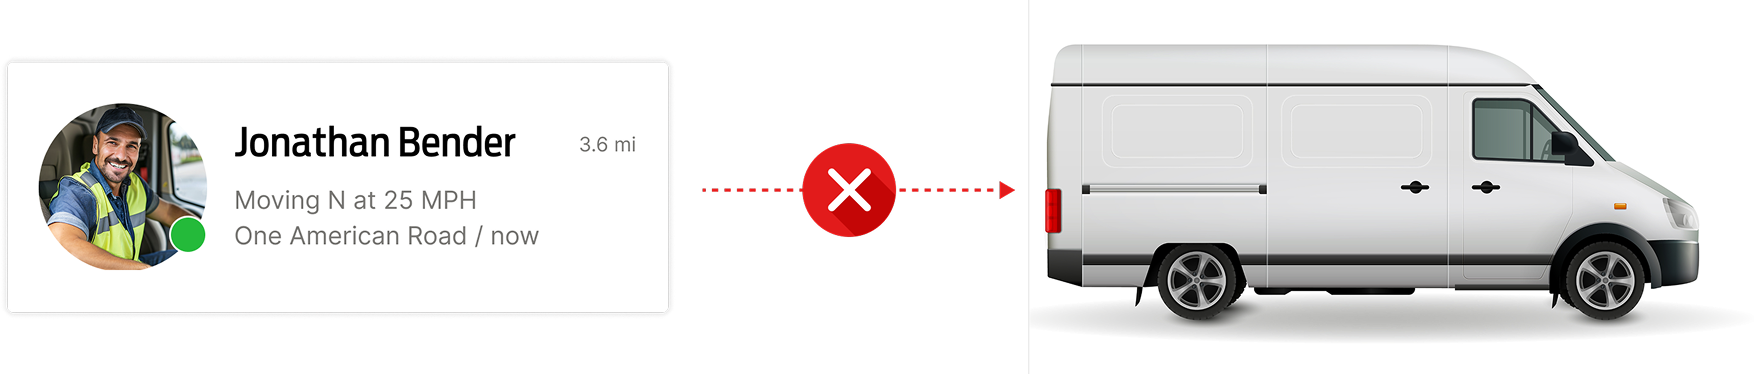
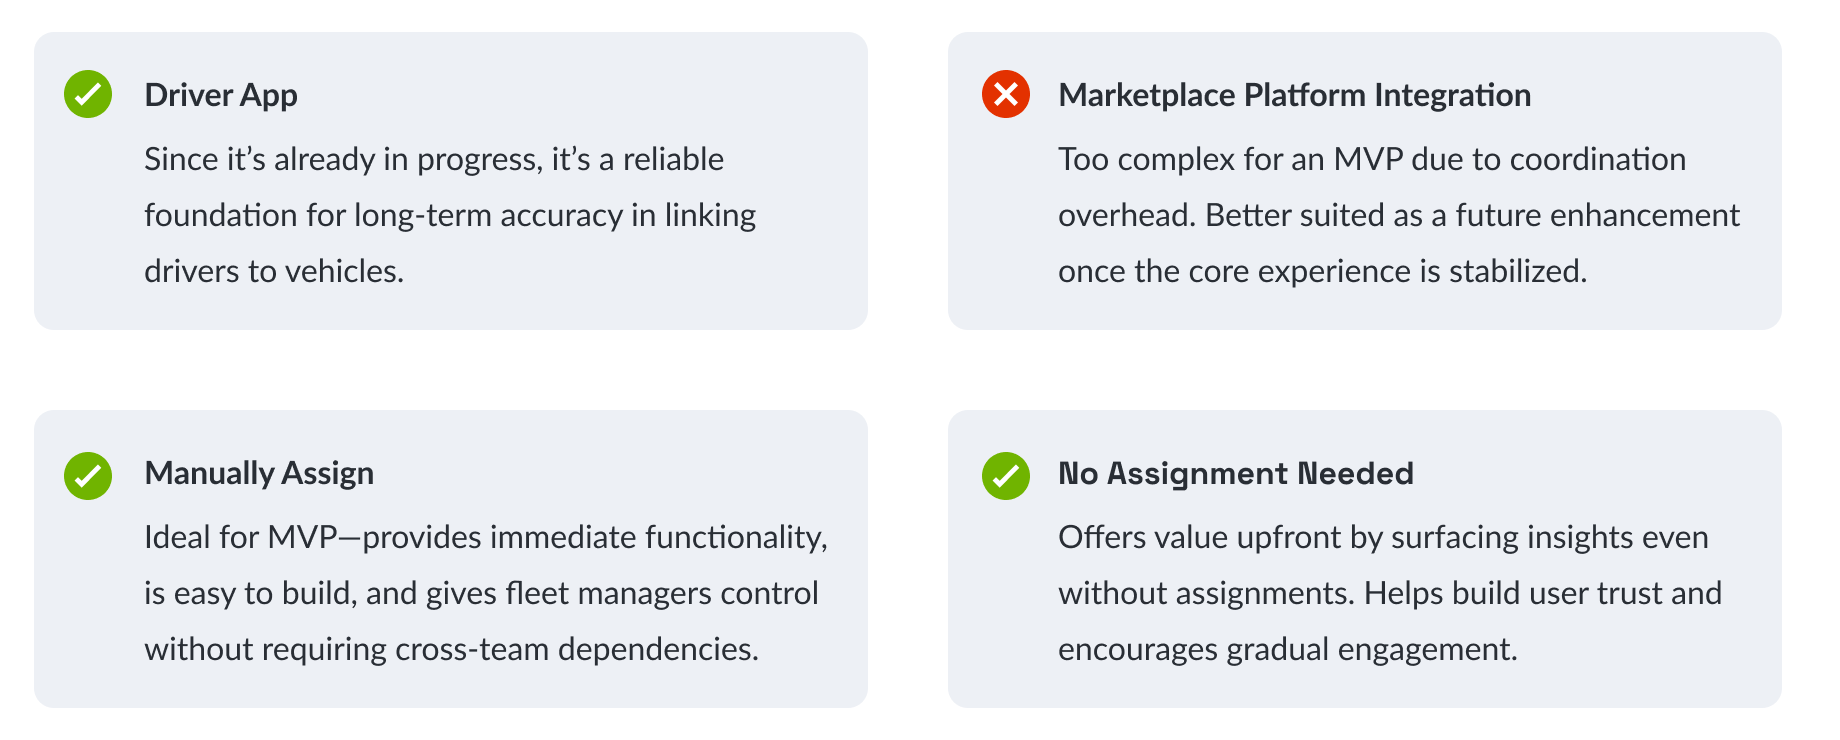
We were initially focused on the ideal scenario — since a team in Europe was building a Driver App in parallel, it seemed easy to capture this information automatically through the app. However, the Driver App is a paid service, and not all users will enroll right away. We needed to provide alternative ways to link drivers and vehicles from day one.


We were initially focused on the ideal scenario — since a team in Europe was building a Driver App in parallel, it seemed easy to capture this information automatically through the app. However, the Driver App is a paid service, and not all users will enroll right away. We needed to provide alternative ways to link drivers and vehicles from day one.

Translated a broad, ambiguous vision into actionable features by breaking down complexity and prioritizing high-value outcomes.
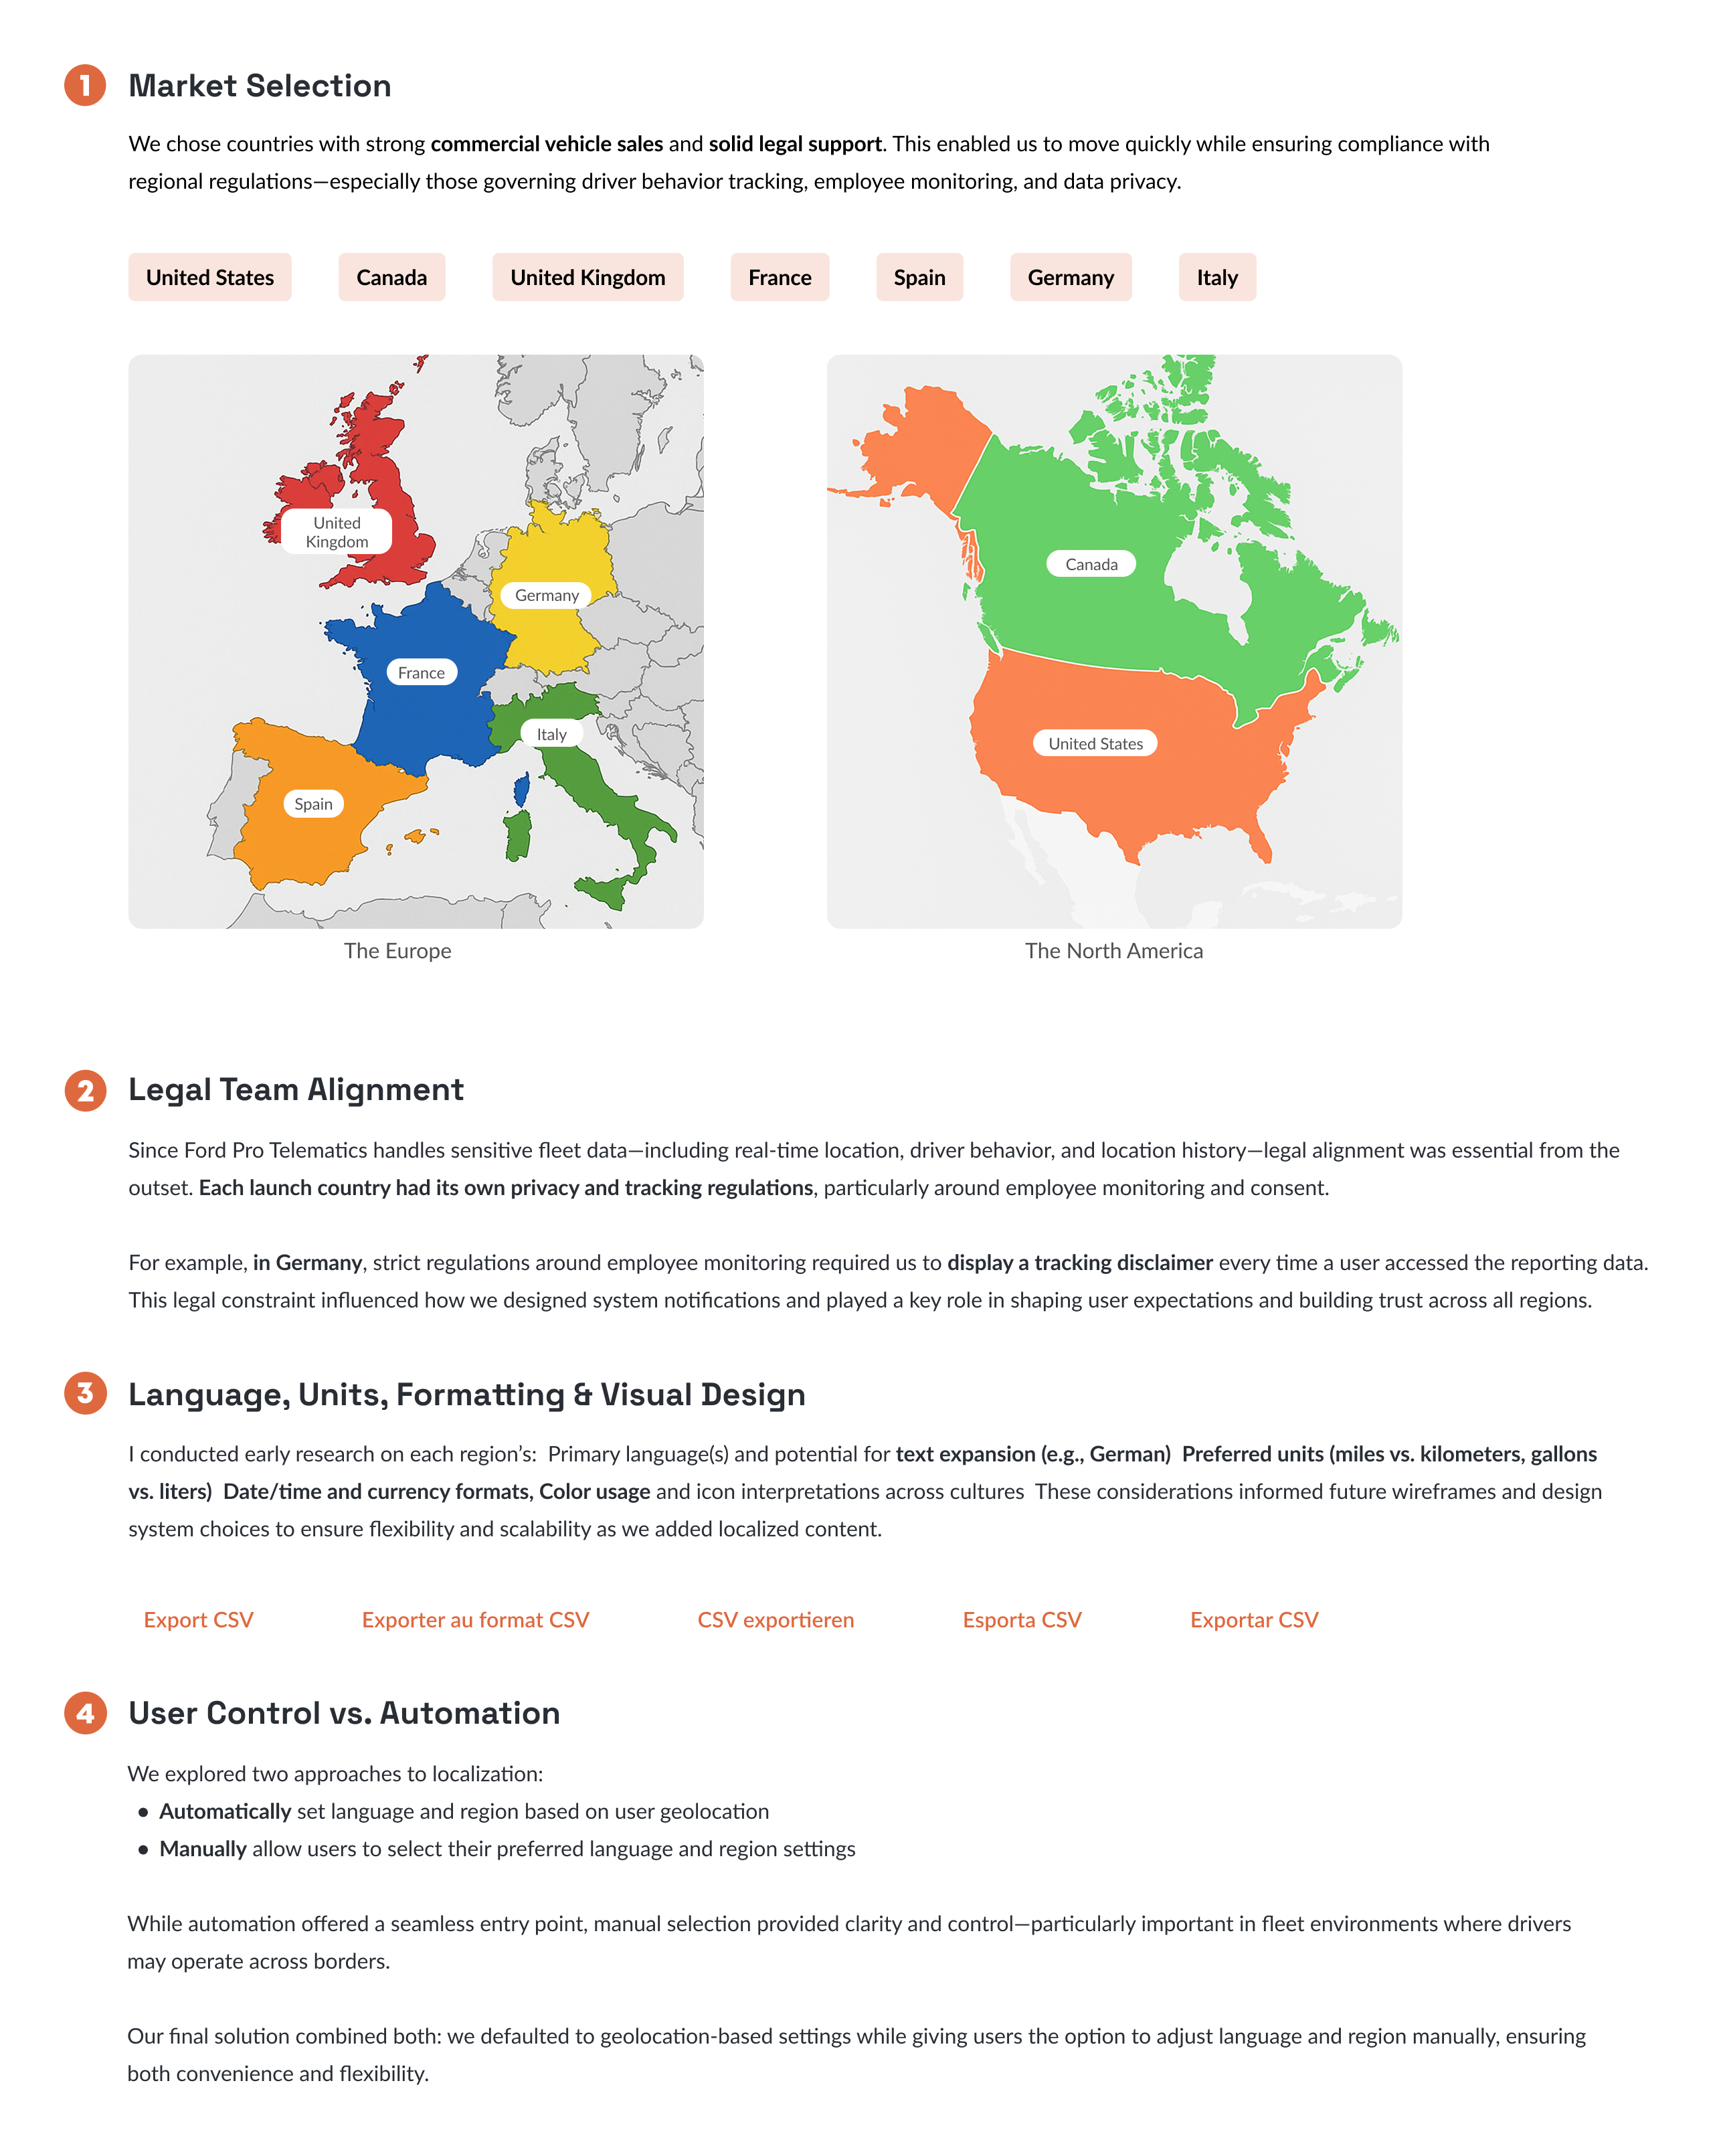
Built scalability from day one to support more events, roles, groups, and international markets.
Challenged default linking logic, enabling insights from both driver and vehicle perspectives.
Made with ❤️ & 🧋 · © Yolie Wang | 2025